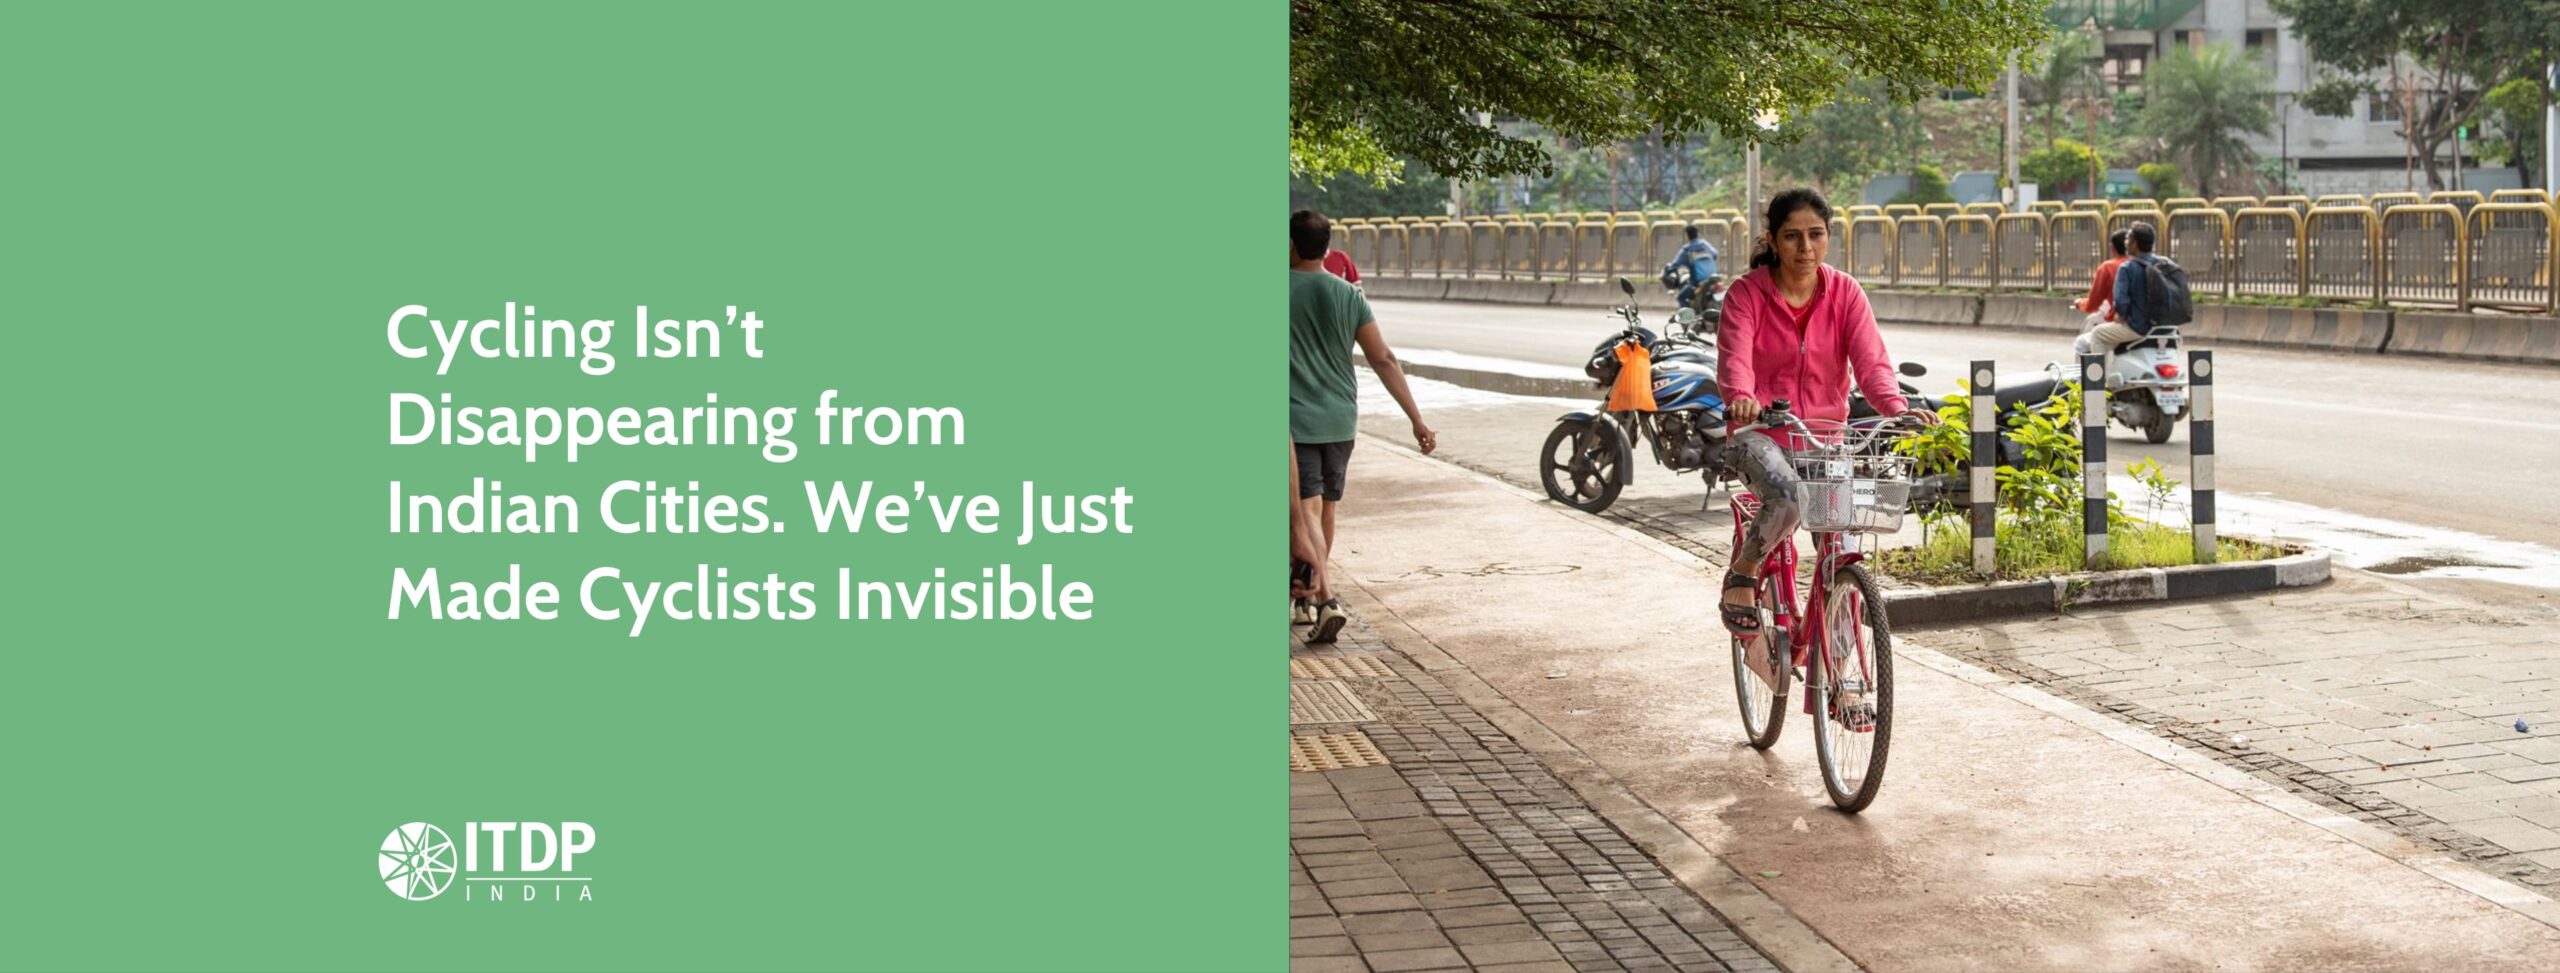
Walk down a busy arterial road in an Indian city and you might conclude that cycling is a thing of the past. But look closer, especially during peak hours, and a different story emerges. On wide streets in Pune, industrial corridors in Pimpri-Chinchwad, and arterial streets in Nagpur, cyclists are very much present. They are just easier to miss because our streets are no longer designed to see them.
A recent study conducted by ITDP India across these three Maharashtra cities (Pune, Pimpri Chinchwad, and Nagpur) found visibly high cycle volumes at peak hours, even on streets where cycling infrastructure is incomplete or poorly enforced. The data challenges a popular myth: cycling hasn’t disappeared. It has simply been pushed to the margins.

Who Are India’s Cyclists Today?
India’s cyclists are not a homogenous group. Some ride to work, some to school, some to save money, and some for health or the environment. According to the survey of over 600 residents in three cities, nearly half of all cyclists use their cycles for daily, non-recreational trips—to jobs, colleges, markets, and homes.
58% of responses from male cyclists said they cycle for recreation and fitness, but women, in particular, seem to rely on cycling as a mode of necessity. Nearly 60% of women cyclists reported using cycles for commuting, education, or errands. This distinction matters because it reframes cycling not as a lifestyle choice, but as essential urban mobility—especially for those with limited access to private vehicles or public transport.
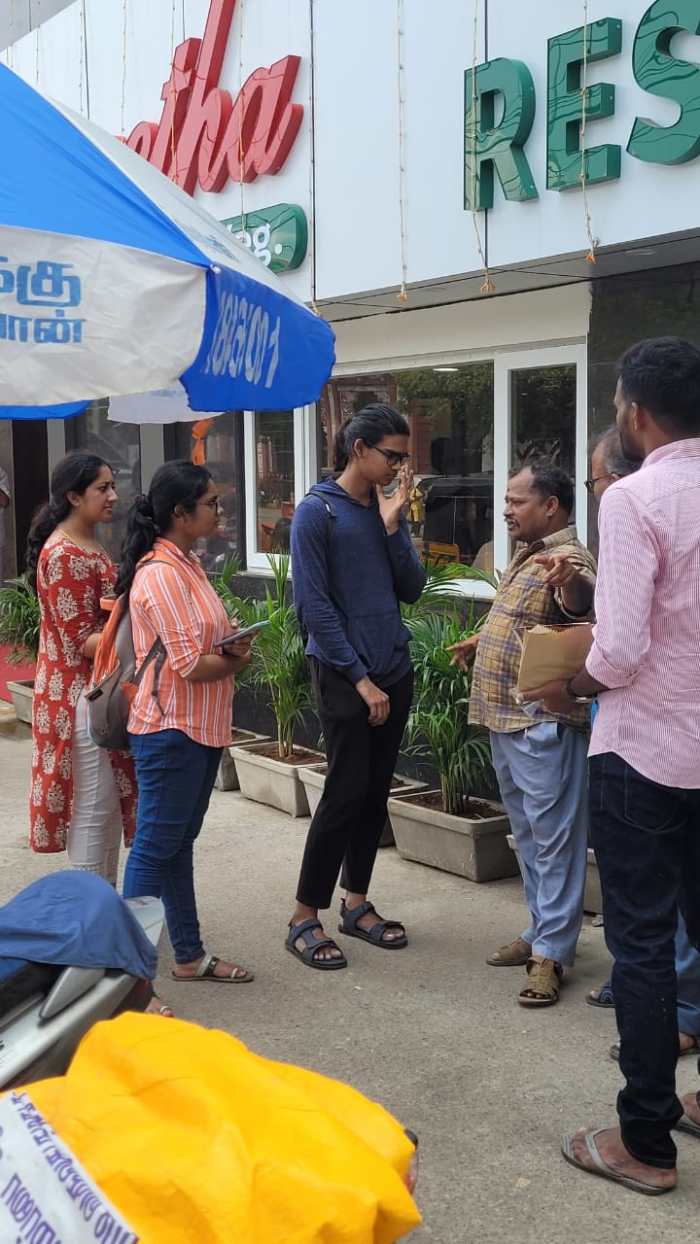
Children, too, are a critical yet overlooked group. Among cyclists under 18, two-thirds cycle primarily to reach schools and colleges, and 84% said they prefer dedicated cycle tracks over mixed traffic conditions. Their message is clear: safety, not speed, determines whether young people cycle. As one student cyclist put it, “Sometimes it gets too hot when I cycle back from school. I wish there were more trees or shade on the way.” Infrastructure, for them, is not just concrete—it is comfort, dignity, and protection. Some also said that their parent didn’t allow them to cycle to school as it was perceived to be unsafe.

Infrastructure Exists. But Is It Working?
Over the past decade, Indian cities have invested in cycling infrastructure. Pune alone has built over 90 km of cycle tracks, Pimpri-Chinchwad more than 50 km, and Nagpur has begun developing an early-stage network.
On paper, the city is making progress—cycle tracks have been built, and space has been allocated. But the reality on the ground tells a different story.
Nearly 60% of cyclists rate segregated cycle tracks as ‘bad’ for comfort, pointing to fundamental design and maintenance issues. More than 60% report that these tracks are frequently obstructed by parked vehicles and vendor encroachments, while 44% highlight discontinuity—tracks that simply disappear mid-route.
Faced with these challenges, cyclists are making a pragmatic choice. Instead of using unreliable and blocked infrastructure, many prefer riding in regular traffic lanes, even if it feels less safe. Ironically, shared streets with traffic calming measures receive better feedback, with 53% rating them as ‘good’ for comfort.
The takeaway is clear: infrastructure alone is not enough. If cycle tracks are not continuous, unobstructed, and comfortable, they fail to serve their purpose—leaving cyclists to navigate the very traffic they were meant to be protected from.

The single biggest complaint across all three cities? Obstructions.
Over 56% of cyclists cited parked vehicles and vendors blocking cycle tracks, while 54% pointed to weak enforcement as a key deterrent. One respondent asked bluntly: “What’s the use of a cycle track if it’s always full of parked vehicles?”
For women, the stakes are even higher. Half reported speeding vehicles and lack of enforcement as major deterrents, and more than 60% flagged poor road conditions and potholes as serious safety concerns. It is no surprise, then, that 87% of women cyclists said they prefer physically segregated cycle tracks.
Regarding surface materials, 52% of respondents preferred asphalt(blacktop) as the ideal material for cycle tracks. Paver clocks are strict no-no as surface materials.

The Silent Majority Waiting to Cycle
Perhaps the most striking finding is not about those who already cycle, but those who don’t.
Among non-cyclists and infrequent cyclists, 72% said they would consider cycling if safe, continuous cycle tracks were available, and 61% said strict enforcement of traffic rules would make a difference. These are not ideological opponents of cycling; they are pragmatic urban residents responding to risk.
With Comprehensive Mobility Plans in these cities ambitiously targeting ~35% of trips by walking and cycling by 2030, there is a clear need for reliable, safe, and high-quality cycling infrastructure—not just to support existing cyclists, but to encourage new users and a broader section of citizens to adopt cycling.
A Way Forward: From Token Lanes to People-Centred Streets
If we really want to see the cyclist back on the streets, we will need to provide dignity, safety and convenience to the users through nuanced design and strict enforcement.
- First, continuity matters more than length. Fragmented cycle tracks that disappear at junctions or merge into traffic are worse than none at all.
- Second, enforcement is infrastructure. Without managing parking, vending, and vehicle speeds, even well-designed tracks fail.
- Third, cities must prioritise vulnerable users—women, children, and older adults—by providing shaded routes, smooth surfaces like asphalt, and traffic calming near schools and neighbourhood streets.
- Finally, shared streets deserve renewed attention. When designed with narrow carriageways, speed tables, and pedestrian priority, they offer inclusive mobility without excessive segregation—an approach that many European cities have embraced and Indian cities can adapt.
Cycling in India is not dying. It is waiting. Waiting for streets that acknowledge its users, protect their journeys, and recognise that a cycle is not a symbol of the past—but a vehicle for a more equitable urban future.
Written by Pranjal Kulkarni, Programme Manager, Healthy Streets, ITDP India
Edited by Kashmira Dubash, Deputy Director, ITDP India